How an inference request finds a pod in Kubernetes
Table of contents

I built an inference demo for Kubernetes Networking na era da Inteligência Artificial, the talk I’m giving with Ricardo Katz at KCD São Paulo 2026. My part follows one request from an Istio Gateway through an InferencePool to a pod simulating a model.
The demo separates two decisions: the Gateway selects a route using an HTTP header; the Endpoint Picker (EPP) selects a pod inside the pool. If the header matches no route, the request ends at the Gateway with a 404. The simulators let me show those decisions without a GPU or an external model provider.
Why inference changes routing
A short question and a request to summarize a long document can hit the same API endpoint while creating very different amounts of work. Counting HTTP requests alone does not tell us how busy a model server is. Prompt length, output length, and requests already waiting on that server all affect how long the next request takes. The llm-d routing guide describes why its router considers server load and cached prompt prefixes.
For an autoregressive LLM, it helps to separate two stages. During prefill, the model processes the input tokens and builds the attention state used to generate the response. During decode, it generates output tokens one at a time. Time to first token (TTFT) measures the wait until the first output token arrives; the pace of the remaining tokens matters after that. The llm-d glossary defines these stages and metrics.
The KV cache holds intermediate attention state so the model does not have to recompute it for every generated token. When a serving engine supports prefix caching, requests with the same opening tokens can also reuse work. A replica that already has a useful prefix in cache may be a better destination than one that needs to process it again. Cache state is one signal; the queue at that replica is another. Sending everything to a warm but overloaded replica can still mean waiting.
An EPP gives the routing layer a place to make that choice. Depending on its implementation and configuration, it can consider queue depth, active requests, or cache information when choosing a model server. That is the production motivation for the architecture. The simulator in this demo does not execute prefill or decode on a real model, and these requests do not establish a benefit from KV-cache reuse.
One request, two decisions
The client runs inside a Kind cluster and sends POST /v1/chat/completions using an OpenAI-compatible API format. The body includes model, but that field does not select the pool in this demo. The X-Demo-Pool header does. I chose that header for the demo; it is not a standard requirement of Gateway API Inference Extension.
There is one HTTPRoute for fast and another for quality. Each route’s backendRef points to its InferencePool. This is an excerpt from fast-route:
apiVersion: gateway.networking.k8s.io/v1
kind: HTTPRoute
metadata:
  name: fast-route
  namespace: ai-networking-demo
spec:
  parentRefs:
    - name: fast-inference-gateway
  rules:
    - matches:
        - path: {type: PathPrefix, value: /v1/chat/completions}
          headers:
            - name: x-demo-pool
              value: fast
      backendRefs:
        - group: inference.networking.k8s.io
          kind: InferencePool
          name: fast-router
parentRefs attaches the route to fast-inference-gateway. Within this match, the path prefix and header condition must both match. The request uses POST because that is how the client calls the completion API; there is no method condition in this route. The HTTPRoute documentation explains how these matches and backend references work.
With X-Demo-Pool: fast, the Gateway selects fast-router. With quality, the other route selects quality-router. There is no Inference Payload Processor (IPP) installed here. The Gateway does not inspect the JSON model field to make this choice.
What the InferencePool and EPP do
An InferencePool describes a group of model-serving pods. Its label selector identifies the members, targetPorts identifies the serving port, and endpointPickerRef associates the pool with its EPP. The InferencePool API documentation covers those fields and how the resource differs from a Kubernetes Service.
In this cluster, the fast pool’s Helm values select app: fast-simulator; the quality pool’s values select app: quality-simulator. Both use port 8000. The EPP chooses an endpoint among the eligible members of its pool. It does not choose which Kubernetes node should run a pod, and it does not decide that a request for fast would be better served by the quality pool.
The request flow has a callout that is easy to miss in a linear diagram:
client -> Istio Gateway
            |
            | HTTPRoute selects the InferencePool
            | Gateway asks that pool's EPP for an endpoint
            | EPP returns the selected endpoint
            |
            +-> selected simulator pod -> Gateway -> client
The Gateway consults the EPP through Envoy’s external processing protocol (ext-proc), then forwards the inference request to the selected pod. The EPP supplies the routing decision; the Gateway proxies the request and response. This is the sequence described in the Gateway API Inference Extension request flow.
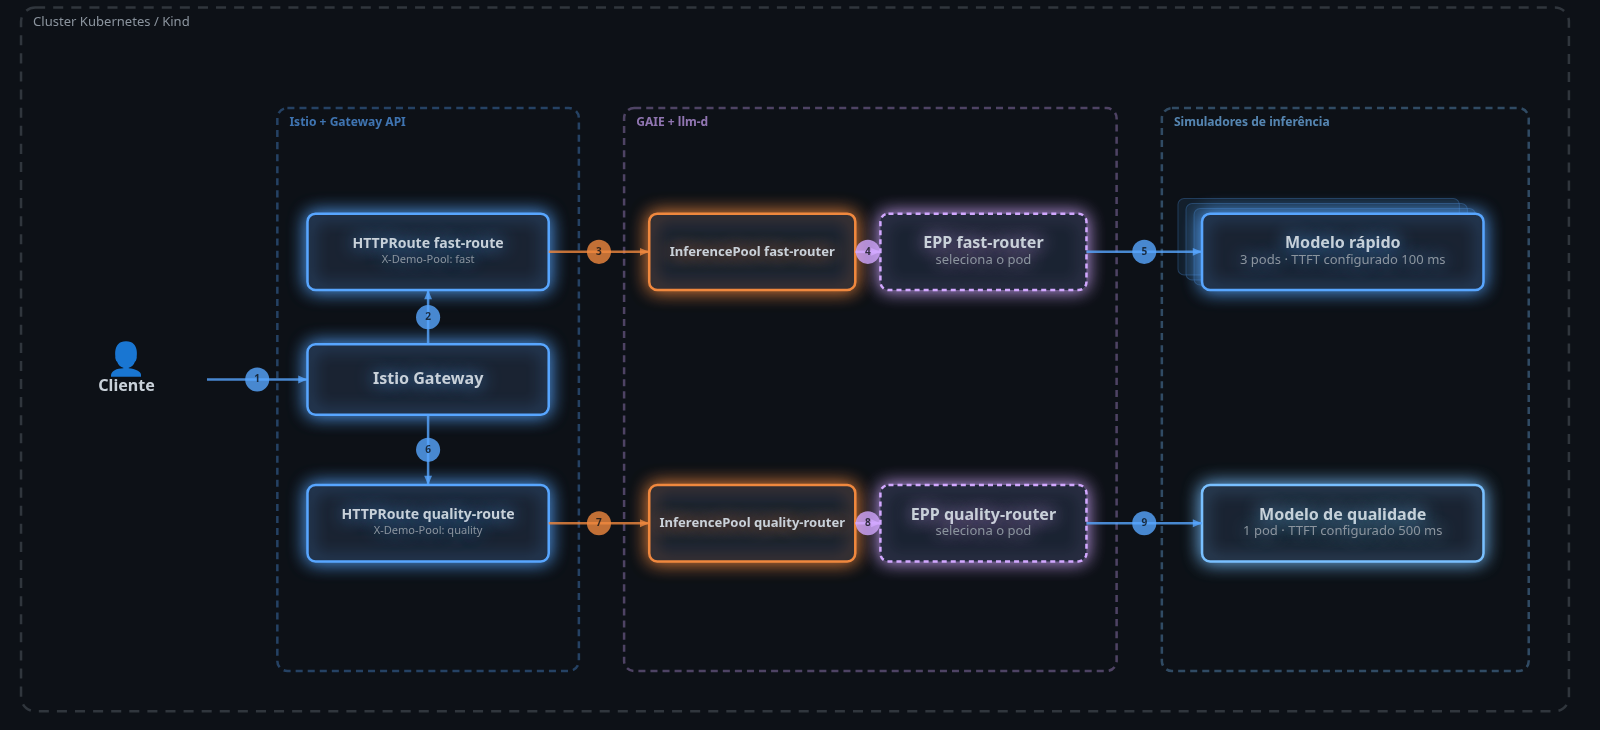 Two routes select separate inference pools and their endpoint pickers.
The interactive overview lets you step through the resources. Its arrows show the order of decisions; the HTTP request goes from the Gateway to the selected pod. These diagrams come from the talk and keep their Portuguese labels: modelo rápido is the fast profile, and modelo de qualidade is the quality profile.
The fast profile
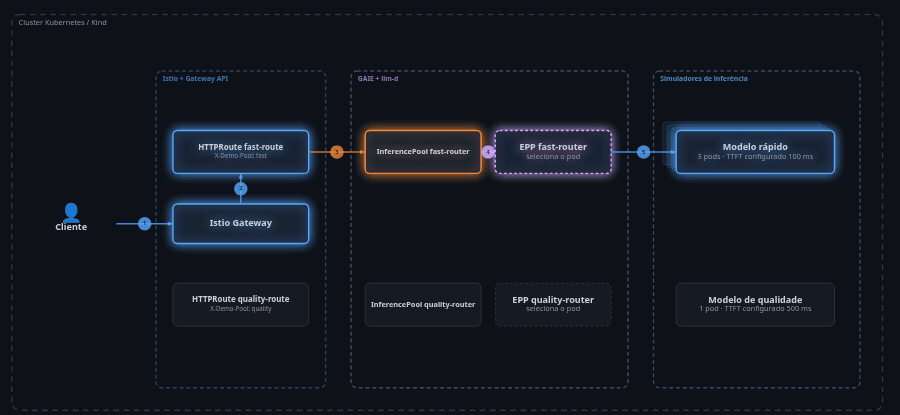 The fast route selects fast-router; its EPP chooses among three fast-simulator replicas.
Open the interactive fast-profile diagram.
The fast profile has three fast-simulator replicas. The simulator Deployment configures each with a 100 ms time to first token. A call from the client inside the cluster looks like this:
kubectl --context kind-kcd-ai-networking-demo -n ai-networking-demo \
  exec deployment/fast-client -- \
  curl -sS -i \
    -H 'Content-Type: application/json' \
    -H 'X-Demo-Pool: fast' \
    -d '{"model":"fast","messages":[{"role":"user","content":"Hello KCD"}]}' \
    http://fast-inference-gateway-istio.ai-networking-demo.svc.cluster.local/v1/chat/completions
llm-d-inference-sim runs in echo mode. It accepts the request format, returns usage, and exposes the responding pod in the x-inference-pod header. I check that header first: a fast-simulator pod confirms that the request reached the expected pool.
In the recording, I also send 12 concurrent requests to fast. They reach all three replicas, with counts of 1, 7, and 4 in that run. Those counts show the requests reached different endpoints. They do not establish a round-robin policy or promise an even split on another run.
The quality profile
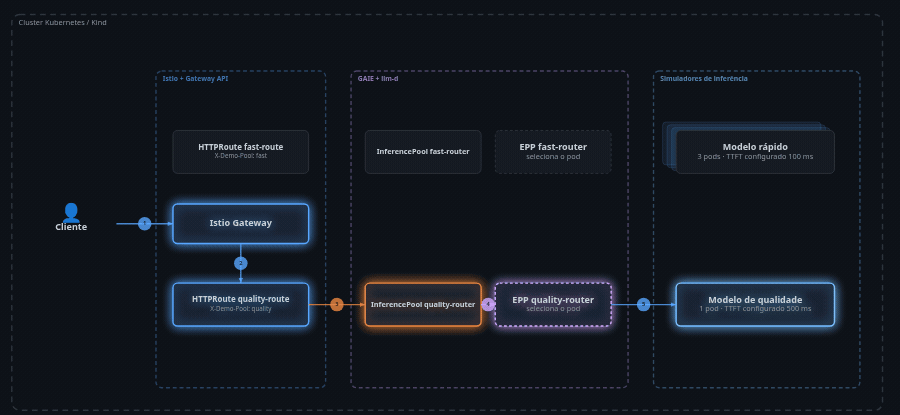 The quality route selects a separate pool with one quality-simulator replica and a longer configured delay.
Open the interactive quality-profile diagram.
For this call, the header is X-Demo-Pool: quality, and the example body uses "model":"quality". The path and Gateway stay the same. quality-route points to quality-router, which has one quality-simulator replica configured with a 500 ms time to first token. Its EPP therefore has a single simulator endpoint to select when that pod is eligible.
These names describe two simulator profiles. There is no real LLM behind either one, so quality says nothing about the quality of the answer. The longer configured delay makes it easy to distinguish the paths during the demo.
The response should identify a quality-simulator pod. That gives us evidence of the route taken without inferring it from how quickly the response arrived.
A header with no route
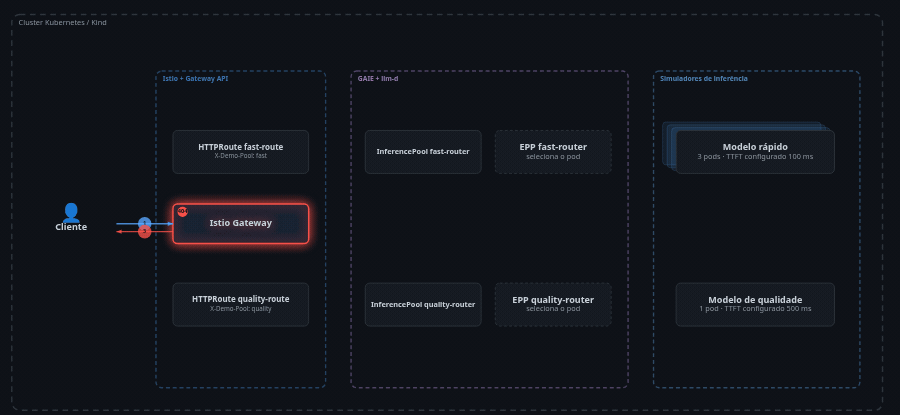 X-Demo-Pool: invalid matches neither route, so the request ends at the Gateway.
Open the interactive invalid-pool diagram.
I send the same API request with X-Demo-Pool: invalid. Neither HTTPRoute matches that value. The Istio Gateway returns HTTP 404 before asking an EPP for an endpoint, and the response has no x-inference-pod header.
The demo calls this the invalid-pool case, but no pool named invalid is looked up. The failure is the route match itself. That distinction helps when debugging: inspect the path, header, and routes before looking for a problem in a model server that never received the request. An EPP failure or an unavailable backend would happen later in the flow and is not what this case tests.
What the stopwatch measures
The 100 ms and 500 ms values are simulator settings. The demo script compares requests using curl’s time_starttransfer, which measures the elapsed time until the client receives the first HTTP byte. It includes connection setup and the time spent waiting for the server. The curl documentation defines this measurement as time to first byte (TTFB).
The script prints that result with a TTFT label. For these requests, TTFB is the accurate name: the body does not request stream: true, and curl does not observe the arrival of an individual generated token. The measured interval also includes the network, Gateway, and endpoint-selection work on the request path. In the recording, the measured TTFB is about 0.105 s for fast and 0.505 s for quality, consistent with the configured delays but also including that request path.
The validation script checks which pod replied and whether the fast request’s first byte arrives sooner than the quality request’s. The recorded response bodies also show usage. These checks establish that the demo routes requests to the intended profiles and exposes their different delays. They do not establish GPU performance, real LLM throughput, token savings, answer quality, or a benefit from cache-aware scheduling.
For a real model, measuring TTFT would require observing the first generated token, and assessing the rest of the response would require additional measurements. The simulator lets us inspect the routing machinery before adding those concerns.
Watch or run the demo
The inference demo recording pauses at each step so you can inspect the pods, routes, and responses without racing the terminal.
The cluster is prepared before the recording. Images and charts are cached for offline installation; during the recorded run, I inspect the resources and send the requests. The project README has the prerequisites and setup commands. The demo code includes the manifests, validation scripts, and diagrams.